

AnyTool Tag & Pixel Inspector
See every tag on a page, and whether it is set up right.
See every analytics, ad and marketing tag on a page, its hits, data layer and consent, with fix suggestions. Local only.
For Google Chrome and Microsoft Edge. Installed manually: no store, no one-click install.
- Version
- 0.1.0
- Released
- October 11, 2026
- File
- anytool-tag-inspector-0.1.0.zip
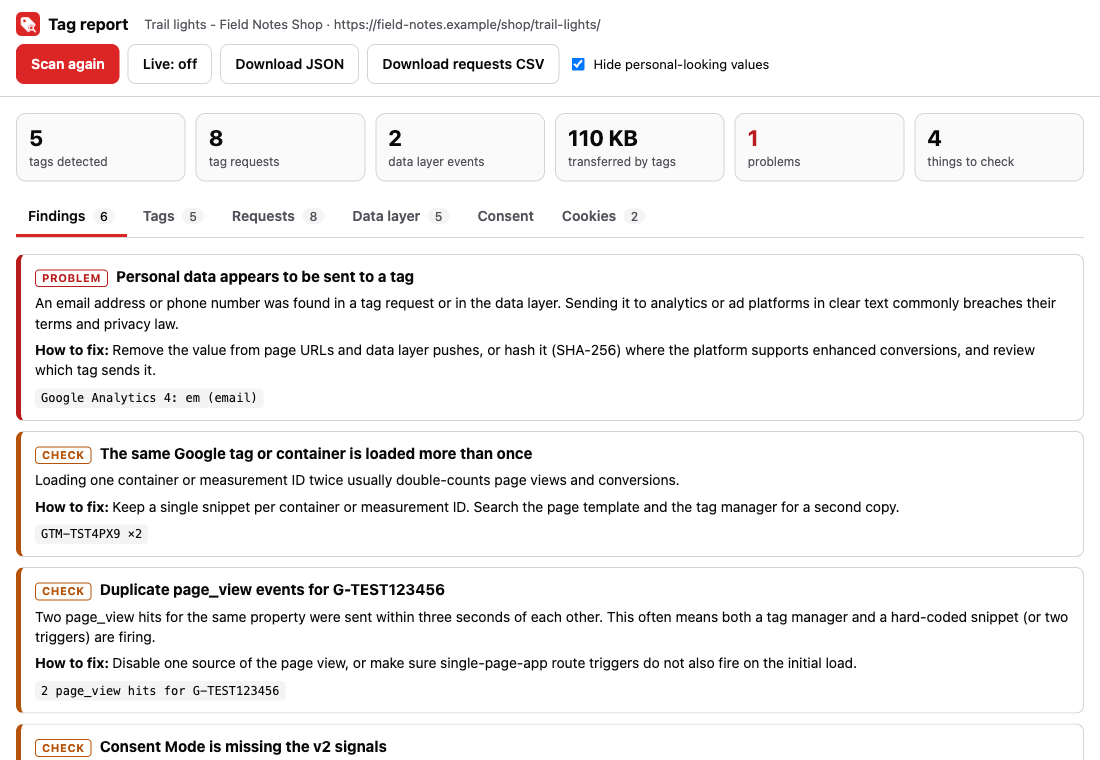
1 / 4 · The tag report showing findings on a sample shop page: a duplicate container, duplicate page views and personal data in a request, each with an explanation and a fix. Shown on a sample page.
What it is
AnyTool Tag & Pixel Inspector scans the page you are on and lists the analytics, advertising, tag manager, session replay, A/B testing, marketing automation, chat and consent tags it can recognise, with their account and container IDs.
It goes further than a list: it shows the hits those tags actually sent (event names, IDs, timings), the contents of the page's data layer, Google Consent Mode state and cookie names, and runs checks for common mistakes such as duplicate containers, duplicate page views, legacy Universal Analytics, personal data in requests and ad pixels firing while consent is denied.
Everything is analysed on your device from what the page exposes to scripts. It is read-only: it does not call tag functions, change the data layer or add anything to the page, and the report tab is the only thing it opens.
Who it is for
Marketers and analysts
See which tags a landing page really runs, whether the Google tag, Meta Pixel and others are present once, and what events they send, before a campaign goes live.
Tag manager and analytics engineers
Verify containers, measurement IDs and data layer pushes during implementation, and watch events arrive in order while you click through a flow.
QA and release testers
Check every release for duplicate tags, missing events and tags that fire when they should not, with an export to attach to the ticket.
Privacy and compliance reviewers
Spot ad pixels firing while consent is denied, personal data in tag requests, and missing Consent Mode v2 signals, then hand findings to the team that owns the tags.
What it does
Features
- Detects 60+ common tags: Google Tag Manager, GA4, Google Ads, Meta, TikTok, LinkedIn, X, Pinterest, Microsoft Ads, Hotjar, Clarity, HubSpot, Segment and more
- Shows each tag's account, container, pixel and measurement IDs, and how it was found
- Lists the hits tags sent, with event names, IDs and timings
- Reads the page's data layer as a searchable timeline of events and consent commands
- Shows Google Consent Mode state (default, update, effective) and detects consent platforms
- Checks for duplicate containers, duplicate page views, legacy Universal Analytics, mixed content, personal data and Consent Mode v2 gaps
- Live mode: watch new requests and data layer events as you use the page
- Hides emails and phone numbers by default in the report and in exports
- Export a JSON report or a CSV of requests
- Works with only activeTab and scripting: no request-blocking or all-sites permission
What it does not do
- Send what it finds anywhere: the report stays in the extension's own tab
- Change the page, fire tags, edit or push to the data layer, or block anything
- Read cookie values, form fields or page content
- Scan a whole site: it analyses the one page you opened it on
- See requests that are blocked, sent in POST bodies, or sent by server-side tagging
Use cases
Check a landing page before launch
Scan the page, confirm the expected tags and IDs appear once each, and read the findings for duplicates or legacy tags.
Debug a missing conversion
Turn on Live, complete the action on the page, and look for the conversion event in the data layer and in the tag's requests.
Audit consent behaviour
Scan before choosing, then accept or reject in the banner and scan again. Compare which tags and requests appear and what Consent Mode says.
Find personal data leaking into analytics
The personal data check flags email addresses and phone numbers in request addresses and data layer pushes, so you can fix the source.
Document a site's tag setup
Export the JSON report to record which vendors and IDs a page used on a given date.
How to use it
- Open the page you want to check and click the AnyTool Tag & Pixel Inspector toolbar icon.
- Choose Scan This Page. A report opens in a new tab.
- Start with Findings, then look at Tags, Requests, Data layer, Consent and Cookies.
- Turn on Live and use the page (accept a banner, add to cart, submit a form) to watch new hits and events arrive.
- Download the JSON report or the requests CSV to share, or choose Scan again after a change.
Step-by-step guide: How to audit the analytics and marketing tags on a web page
How it works
A read-only scan in the page's own context
Tags and the data layer live in the page's JavaScript, which an ordinary extension script cannot see. The scanner runs in the page context, reads only, and returns plain data. It does not call tag functions or patch the data layer.
Requests come from the browser's own timing log
The page's requests, with their addresses and timings, are recorded from the browser's Resource Timing API. That is why request bodies are not available, and why no network permission is needed.
Recognition is by host, path, global and snippet
A vendor is matched by the address of its script or hits, a global it defines, or a signature in an inline snippet. Account IDs are read from those same places.
Checks are explicit rules
Each finding is a named rule with a plain explanation and a suggested fix. There is no scoring model and nothing is sent anywhere.
Tips for better results
- Scan once before and once after you accept the consent banner, and compare.
- Turn on Live before an action you want to verify, such as a purchase, so the events are captured in order.
- Use the Requests search to find an ID: paste a measurement ID or pixel ID to see every request that carries it.
- Leave Hide personal-looking values on when you share a report.
- Open the data layer entries to check parameter names and types, not only event names.
- Re-scan after publishing a tag manager change; the page must be reloaded to pick up a new container version.
Compared with other options
How checking tags with this extension compares with the other usual approaches.
| Option | Best for | Trade-off |
|---|---|---|
| Browser DevTools Network tab | Full request detail, bodies and headers when you know exactly what to look for. | Every request on the page, with no recognition of vendors, IDs or events, and no checks. |
| Tag manager preview mode | Debugging one container, with tag firing order and variable values. | Shows only that container, and needs access to the account. It does not see tags outside it. |
| Vendor-specific debug extensions | Deep detail on one platform's pixel. | One extension per vendor, each with its own interface and permissions. |
| AnyTool Tag & Pixel Inspector | A quick, whole-page view across many vendors, with data layer, consent and fix suggestions, on a single page, locally. | Cannot see request bodies, server-side tagging or blocked requests; the vendor list is curated. |
Permissions explained
The extension asks for the following browser permissions and nothing else. It requests no access to all websites.
| Permission | Why it is needed |
|---|---|
| activeTab | Lets the extension work on the tab you open it from, only after you click the toolbar icon. |
| scripting | Runs a read-only scanner in the current tab, in the page's own JavaScript context, so it can read the data layer and tag globals. |
Privacy
What it reads
- Which known tag scripts and globals exist on the page, and the account, container and pixel IDs in their addresses and snippets.
- The addresses, types and timings of requests the page made, as reported by the browser. Only requests to recognised tag hosts are analysed.
- The entries of the page's data layer, limited in size. Personal-looking values are hidden in the report by default.
- Google Consent Mode state when the page exposes it, and the names of consent platforms.
- Cookie names only. Never cookie values, form fields or page text.
What it keeps
- The scan is held in the extension's own IndexedDB storage while its report tab is open, and deleted when the tab closes. Anything abandoned is removed after six hours.
- A JSON or CSV file only exists if you download it, and then it is under your control. Downloads are masked unless you turn masking off.
Nothing it reads is sent to AnyTool Studio or any other server. Read the full privacy notice.
Browser compatibility
Google Chrome
Manifest V3, Chrome 116 or later.
Install from the ZIP download above. Not currently listed in the browser store.
Microsoft Edge
Manifest V3, Edge 116 or later.
Install from the ZIP download above. Not currently listed in the browser store.
Limitations
- It sees what the browser exposes to page scripts: request URLs and timings, not request bodies. GA4 and other tags that send batched hits in a POST body show the request but not its parameters.
- Server-side tagging endpoints on your own domain, and requests blocked by an ad blocker or consent tool, are not visible.
- Only recognised tags are listed. The built-in list is a curated set of 60+ well-known vendors, not every script on the web.
- On very busy pages the browser may have dropped early requests from its small resource buffer before the scan; Live mode records everything from the moment it starts.
- The data layer view shows the most recent 300 entries, each limited in size. Consent state is shown only when the page exposes it.
- Findings are heuristic prompts to investigate, not legal or compliance advice.
- Pages that rely on consent show different tags before and after a choice; scan again after choosing.
Extension or online tool?
Extension. Use the extension to check what tags a page loads, what they send and whether common mistakes are present, without installing a tag-debugging suite or opening the Network tab.
Online tool. Use the AnyTool Studio marketing tools to build and analyse campaign URLs and UTM parameters. They work on links, not on the page's live tags.
Troubleshooting
Scan This Page does nothing or shows an error.
Browser-internal pages and extension stores cannot be scanned. Open a normal website and try again.
The report shows no tags but I know there are some.
They may load only after a consent choice or later in the page. Open Live mode, accept the banner and interact with the page.
Live mode stopped.
The browser ends the extension's access when the tab navigates. Click the toolbar icon on the page again and scan.
A tag I use is not recognised.
The vendor list is curated and conservative. Unrecognised scripts are not listed, but their requests still appear in the browser's own Network tab.
Frequently asked questions
Does it send my page data anywhere?
No. The scan and the report stay on your device. The extension makes no network requests of its own, and its pages are restricted by a content security policy that does not allow any.
Will it fire or change my tags?
No. It only reads. It does not call tag functions, push to the data layer or patch any page function.
Can it see cookie values or form data?
No. Cookie names are listed so you can tell which tags set cookies; values are never read, and neither are form fields.
Why are some of my hits missing parameters?
Browsers expose a request's address but not its body. Tags that send hits in a POST body appear as requests without their parameters.
Is a clean report a guarantee that tracking is correct?
No. The checks are a fast first pass over what the page exposes. They cannot see server-side tagging, blocked requests, or what happens after login.
Which tags does it recognise?
More than 60 well-known vendors across tag managers, analytics, advertising pixels, session replay, A/B testing, marketing automation, chat widgets, consent platforms and monitoring. The list is curated and conservative: a match means something.
What is Live mode?
While it is on, the report asks the page for new requests and data layer entries about once a second and adds them. It does not change the page. It ends if the tab is navigated, because the browser then withdraws access.
What does Hide personal-looking values do?
It replaces email addresses and phone-like numbers in request addresses with a placeholder and removes query strings from embedded page URLs, in the report and in downloads. Turn it off only when you need the raw values and will not share them.
Can it check Consent Mode v2?
It reads the consent state the page exposes and flags a missing ad_user_data or ad_personalization signal when Google advertising tags are present. It cannot verify what your consent platform shows visitors.
Does it work on single-page apps?
Yes. The data layer and requests keep updating as the app changes routes. Use Live mode or Scan again after navigating inside the app.
Why does it ask for scripting?
Scripting is how the scanner is run in the page, in the page's own context, to read the data layer. It is only run after you click Scan This Page.
Does it work in Microsoft Edge?
It is built for Chrome and Edge (version 116 or later). It was tested in Chromium and Google Chrome; an Edge-specific test pass is still to be done.
Related extensions
 InspectDirect download
AnyTool Font & CSS Inspector
Understand the design behind any element.
Click any element for fonts, colors, contrast, spacing and CSS variables, plus a page palette. Copy values or CSS.
- Hover highlight with a size and tag tooltip
- Click to select, arrow keys to move to parent or child
- Font family, size, weight, style, line height and letter spacing
View details
 ExtractDirect download
AnyTool Smart Data Extractor
Turn visible page data into useful files.
Export HTML tables and repeated items like lists and cards from the page you are viewing to CSV, JSON or XLSX.
- One-click auto-detect of the most substantial table or list on the page
- Finds every HTML table on the page and previews the first rows
- Point-and-click selection of repeated elements (cards, list items, rows)
View details